Urban greening provides significant community, environmental and economic benefits. This valuable community asset includes all trees across public and private land.
Accurate, timely and relevant data and mapping underpins smart decisions and fosters a shared understanding of the city’s urban greening profile. This data supports the State Government and key stakeholders, including local governments, to monitor vegetation trends, make strategic decisions and clearly report progress over time.
Since 2014, the Western Australian Planning Commission (WAPC) has published spatial data on vegetation within Perth and Peel on the Urban Tree Canopy Dashboard. This dataset, referred to as Urban Forest, summarises vegetation cover by individual land parcels (lots).
Let’s Grow Urban Greening Dashboard
The Let’s Grow Urban Greening Dashboard provides an interactive overview of tree canopy and other vegetation coverage across the Perth and Peel regions. The dashboard summarises Urban Forest data by street, suburb, local government area and sub-region – and can be explored by land use and vegetation height.
This dashboard builds on the earlier Urban Tree Canopy Dashboard, first released in 2020 to support local governments in accessing Urban Forest data within their local government areas.
The updated Let’s Grow Urban Greening Dashboard:
- improves accessibility for a broader range of users
- supports analysis across multiple spatial scales
- provides more flexible data exploration options.
The archived Urban Tree Canopy Dashboard remains available for reference but is no longer maintained.
About the data
High-resolution aerial imagery of Perth and Peel is captured through Landgate’s Capture WA program. This imagery is processed by the Commonwealth Scientific and Industrial Research Organisation (CSIRO) into Urban Eye data using their Urban Monitor approach. Vegetation data from Urban Eye is then summarised by parcel and vegetation height and combined with other land information to produce Urban Forest data.
Imagery is captured annually in mid-to-late summer. Urban Eye and Urban Forest datasets are processed and released every two years to enable monitoring of vegetation trends.
The Let’s Grow Urban Greening Dashboard further summarises Urban Forest data by various categories in an accessible, interactive web-based format.
Accessing the data
Urban Forest data is available in several formats to support a range of user needs and technical capabilities.
| Urban Eye | Urban Forest - GIS layers | Urban Forest – web viewer | Urban Greening Dashboard |
|---|---|---|---|
| Very high resolution raster data representing vegetation. Produced through CSIRO’s Urban Monitor program and available to government users via Capture WA. | Summarises Urban Eye data by parcel (lot) and ABS Mesh Block, enriched with land information. Suitable for geospatial (GIS) analysis. | An interactive map displaying Urban Forest data. Users can explore data for individual parcels or Mesh Block areas. | Summarises Urban Forest data to suburb scale and integrates supporting data to provide an interactive, user-friendly dashboard. |
| Urban Eye | Data WA | Urban Forest data | Data WA | Urban Forest data | PlanWA | Urban Greening Dashboard |
For further guidance on accessing and using Urban Greening data, email urbangreening@dplh.wa.gov.au
Local government users
Local governments can access over a decade of Urban Forest and Urban Eye GIS data at no cost.
The Let’s Grow Urban Greening Dashboard includes views tailored to local government users’ needs, supporting analysis at a local scale. Features will continue to evolve in response to user feedback.
Developed in association with the WA Local Government Association (WALGA), the Better Urban Forest Planning guide supports local governments and the community to plan and manage urban forests for current and future generations.
The guide includes practical advice on using Urban Forest data in planning activities.
FAQ - Urban Greening Dashboard
Show moreWhat is the Let’s Grow Urban Greening Dashboard?
The dashboard uses the same Urban Forest data as the previous Urban Tree Canopy Dashboard, with an updated interface designed to improve usability and accessibility. New features include:
- a customisable table designed for local government users
- improved map-based exploration
- an interactive guided tour.
These updates align with the State Government’s Open Data Policy and support ongoing improvement of urban greening data in line with the Let’s Grow Action Plan (1.16).
Can I still access the previous dashboard?
The Urban Tree Canopy Dashboard interface is no longer maintained. It will remain visible while users transition to the new dashboard, but new data will not be displayed. View the archived Urban Tree Canopy Dashboard.
Can I compare data between years?
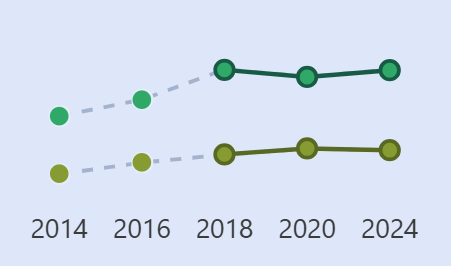
Data from 2014 onwards is published on the Let’s Grow Urban Greening Dashboard and can be compared year-to-year. In some instances, if aerial capture coverage was not consistent, this may result in some isolated areas not being able to be compared across years.
Look for dotted lines in the trend chart (top right). Hover over data points to view tooltips showing total captured area and notes on comparability.
What areas of Perth and Peel are included?
Urban Forest includes data from land and water. The dashboard shows all Urban Forest data within the Perth and Peel region, excluding open waterbodies like oceans or estuaries.
This approach aligns with the principles of the Western Australian Whole of Government Open Data Policy.
Why are shrubs and other vegetation included?
Tree canopy (trees three metres or taller) remains the primary focus; however, the dashboard also reports on shrubs (0.5 to three metres) and ground layer vegetation (smaller shrubs, grasses and turf less than 0.5 metres). This provides a more complete picture of vegetation structure and change.
Vegetation height information is available via tooltips by hovering over relevant visuals.
FAQ - Urban Forest data
Show moreWhy do Urban Forest canopy statistics differ from other sources?
Each remote sensing product is designed for a specific purpose and may use different assumptions, methodology, timing and vegetation classification.
When these design choices differ, the resulting statistics will differ. While other datasets can be useful complements, figures from different providers are not directly comparable.
Urban Forest provides standardised, region-wide data to support long-term monitoring of vegetation cover.
If urban greening data is updated every two years and published on the dashboard, why isn’t the 2022 data available?
The 2022 data was not included due to the transition of data procurement and contract management responsibilities from DPLH to Landgate between 2021 and 2023. This transition aimed to enhance canopy data accessibility across the WA public sector.
Will the State Government process and publish the 2022 data?
Yes, the 2022 data will be retrospectively processed and published to address this crucial data gap. The new methodology will be applied to enable a direct comparison between 2022 and 2024.
DPLH continues to work with Landgate to enhance urban greening data, tools and mapping.